
RBT Data Collection and Graphing Study Guide 2026
RBT data collection and graphing is the part of the exam where one small word decides the answer. “At any point in the interval” and “for the whole interval” look almost the same when you are tired and the timer is running, but they point to two different methods. Latency and IRT both measure time, yet they start the clock at different moments.
This guide walks you through all 8 RBT data collection and graphing tasks with session examples, simple pictures, and the traps that cost students the most points. If you are still building a plan for the whole exam, start with our RBT study guide and come back here when you reach Domain A.
RBT data collection and graphing is Domain A of the 2026 RBT exam. It has 13 of the 75 scored questions (17%) and covers 8 tasks: continuous measurement, discontinuous measurement, permanent product recording, entering data and updating graphs, describing behavior and environment, calculating data, reading trends, and the risks of unreliable data. Older study material calls this section “Measurement.”
Only have 10 minutes? Jump to the cram sheet ↓
Measurement vs Data Collection and Graphing: What Changed in 2026
If you search for “RBT measurement,” you will still find plenty of flashcards and quizzes. That was the name of Section A in the old RBT Task List (2nd ed.). Starting in 2026, the exam follows the RBT Test Content Outline (3rd ed.), and the same section is now called Data Collection and Graphing. In other words, “RBT measurement” and “RBT data collection and graphing” are the same part of the exam.
Most of the old material is still useful. The real difference is three new tasks at the end, so an older flashcard deck will leave gaps right where newer questions are written. Here is how the old list maps to the new one:
| Old task (2nd ed.) | New task (3rd ed.) | What it means for you |
|---|---|---|
| A-1 Prepare for data collection | No longer a separate task | You still need a timer, a data sheet and a clear definition before the session starts. |
| A-2 Continuous measurement | A.1 Continuous measurement | Latency and IRT are now named in the task, so expect questions on both. |
| A-3 Discontinuous measurement | A.2 Discontinuous measurement | Same content: partial interval, whole interval, momentary time sampling. |
| A-4 Permanent-product recording | A.3 Permanent product recording | Same content. |
| A-5 Enter data and update graphs | A.4 Enter data and update graphs | Same content. |
| A-6 Describe behavior and environment | A.5 Describe behavior and environment | Same content. Don’t skip the environment part. |
| None | A.6 Calculate and summarize data NEW | Rate, mean duration and percentage. |
| None | A.7 Identify trends in graphed data NEW | Trend, level and variability. |
| None | A.8 Risks of unreliable data and poor procedural fidelity NEW | Why sloppy data and sloppy procedures hurt clients. |
A.1 Continuous Measurement: Record Every Time It Happens
Continuous measurement means you record every instance of the behavior while you observe. It works best when the behavior has a clear start and end, and you can keep your eyes on the learner. The task lists four types: frequency, duration, latency, and interresponse time (IRT).
Frequency (count) and rate
Frequency is how many times a behavior happens. A learner asks for a break 7 times in a session, so you record 7. Rate adds time to the count: the count divided by how long you watched.
Rate matters when sessions are not the same length. Five hits in a 1-hour session and five hits in a 3-hour session are two very different days. The BACB’s own sample question in the RBT Handbook is a rate-per-hour question, which tells you this kind of math is fair game on test day.
Duration
Duration is how long the behavior lasts, from the moment it starts to the moment it stops. Use it when length matters more than count, like a tantrum, time on task, or time seated at the table. Two tantrums lasting 1 minute and 25 minutes would both be “1” with frequency, and that hides the real story.
Latency
Latency is the time from an instruction or cue to the start of the response. You say “Line up,” and the learner starts walking 8 seconds later. Latency is 8 seconds. Teams use it when the goal is a quicker start, such as following directions or answering to their name.
Interresponse time (IRT)
IRT is the time between two responses of the same behavior, measured from the end of one to the start of the next. A learner swallows one bite and takes the next bite 40 seconds later, so the IRT is 40 seconds. It is useful when the goal is to space a behavior out, like slowing down very fast eating.
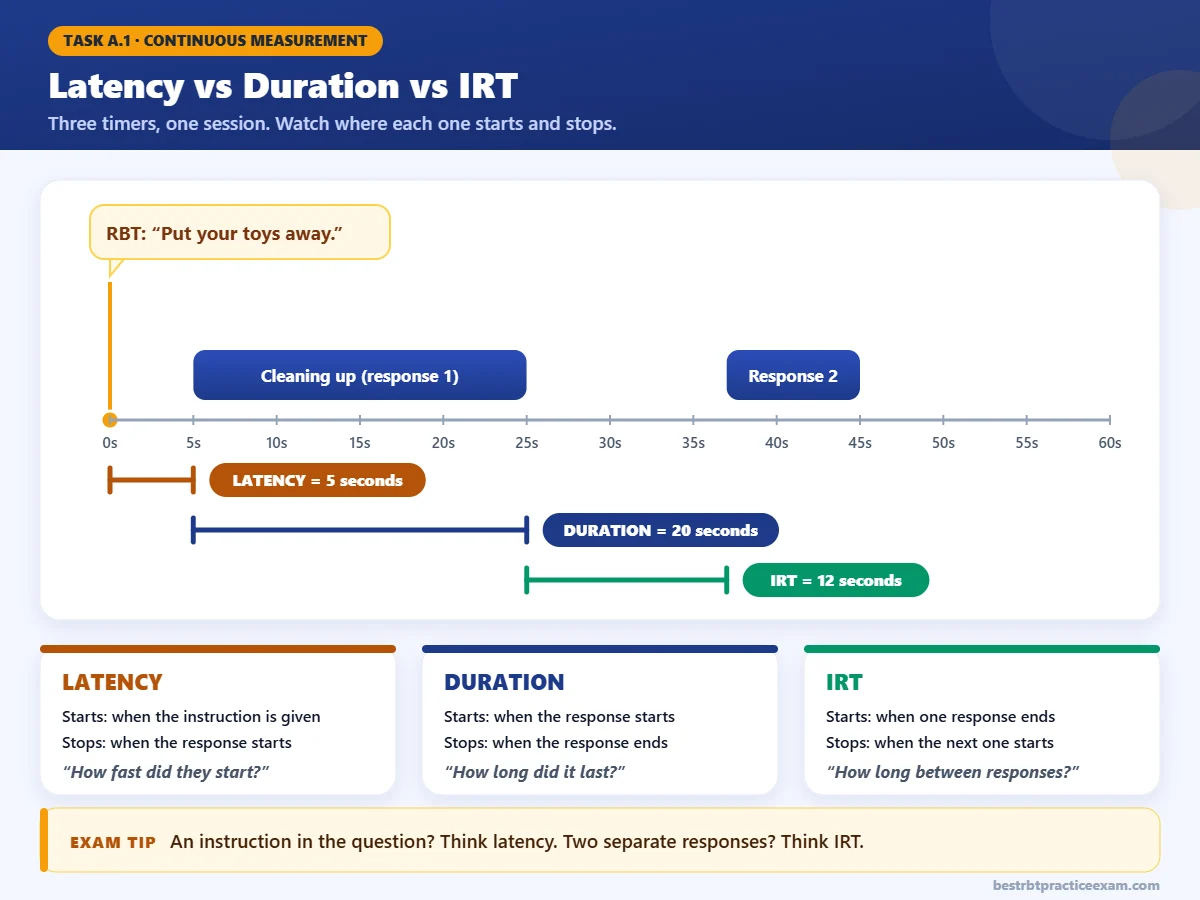
Latency vs IRT: The Trap That Costs the Most Points
Ask yourself one question: what starts the clock? If an instruction or cue starts it, the answer is latency. If the end of the last response starts it, the answer is IRT. Duration never measures a gap. It measures the behavior itself.
| You want to know… | Use | Session example |
|---|---|---|
| How many times? | Frequency | Counting each “break” request |
| How many per hour, when sessions differ | Rate | 6 hits in 2 hours = 3 per hour |
| How long it lasts | Duration | Crying from 3:10 to 3:16 = 6 minutes |
| How fast they start after a cue | Latency | “Shoes on” → reaches for shoes after 10 seconds |
| How much time passes between responses | IRT | 40 seconds between bites |
A.2 Discontinuous Measurement: Partial, Whole and Momentary
In a real session, you are teaching, prompting, and keeping everyone safe. You can’t always record every single instance. Discontinuous methods split the session into short intervals and give you a sample instead of a full count. That saves effort, but every one of these methods gives an estimate, never the exact amount.
Partial interval recording
Mark the interval if the behavior happened at any point in it, even for one second. A quick yell fills the whole box, so partial interval tends to overestimate. That is why it is a common choice for behaviors the team wants to reduce. If the number still goes down, the progress is real.
Whole interval recording
Mark the interval only if the behavior lasted the entire interval. One short break and the box stays empty, so whole interval tends to underestimate. It fits behaviors the team wants to increase, and that should last, like staying on task or playing with a peer.
Momentary time sampling (MTS)
Look up only at the end of each interval and mark whether the behavior is happening at that exact moment. It is easy to run in a busy room, even while you watch more than one learner. The catch is that anything between checks is missed, so MTS can be off in either direction.
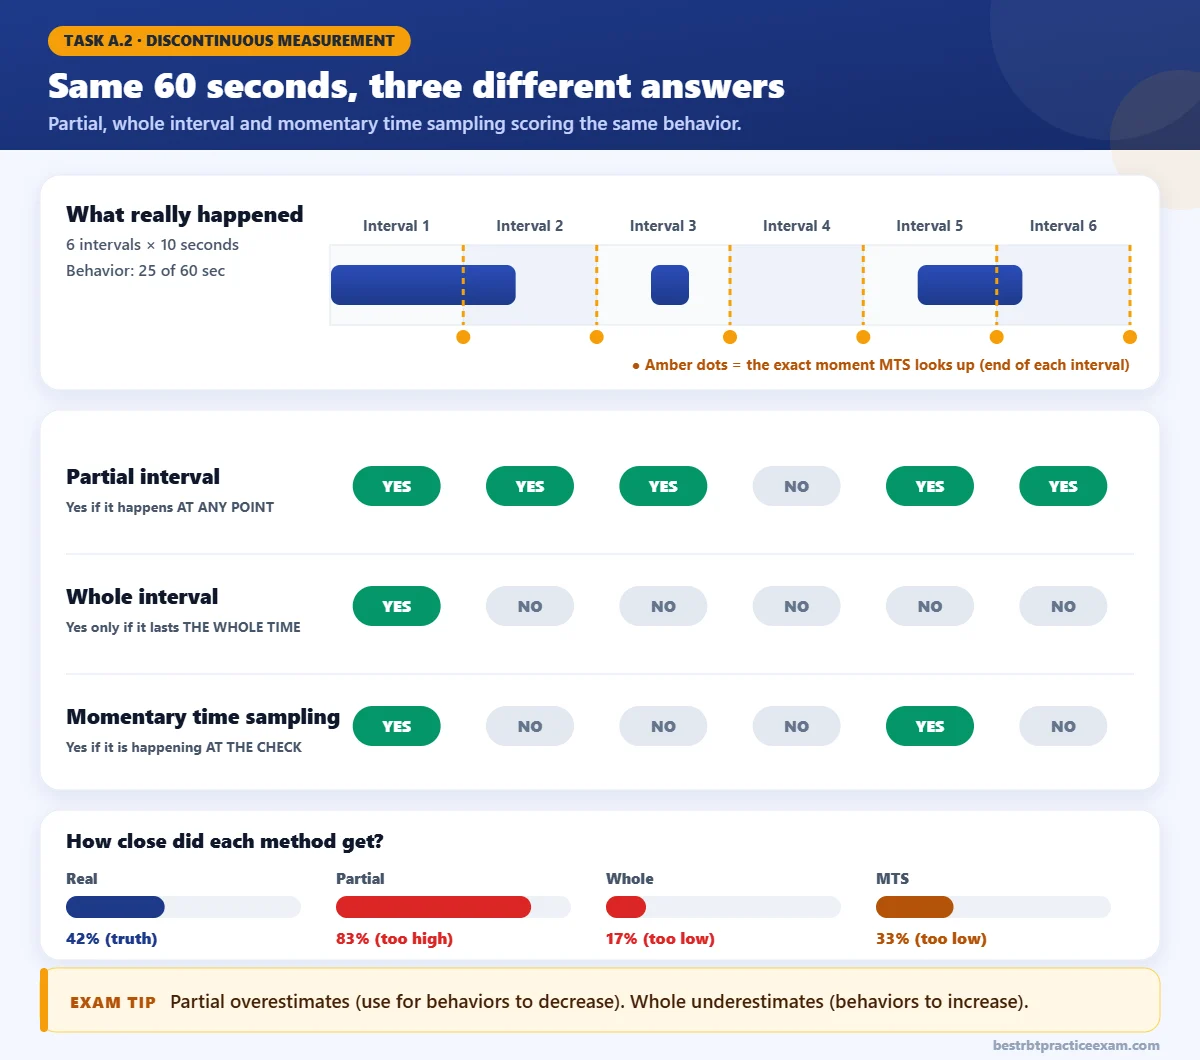
Partial = Problem behavior (overestimates). Whole = Wanted behavior (underestimates). Momentary = the Moment the timer beeps. If a question says “at the end of the interval,” the answer is momentary time sampling.
Picture a small group with three learners and one RBT. Your supervisor sets a 2-minute vibrating timer for on-task behavior. Each time it buzzes, you glance at your learner and mark yes or no, then go right back to teaching. You never stop the lesson to stare at one child. That is MTS doing exactly what it was built for.
A.3 Permanent Product Recording: Measure What Is Left Behind
Some behaviors leave proof behind: a finished worksheet, a made bed, toys back on the shelf, a spelling test. You can score these after the behavior is over, so you don’t have to watch it happen. If you grade a 20-word spelling test and 18 words are correct, you record 90%.
The weak spot is that a product doesn’t show how it was made. Did the learner do it alone, or did a brother help? Was it done with prompts? If you know something like that, write it in your notes so the number doesn’t mislead the team.
A.4 Enter Data and Update Graphs
This is where RBT data collection and graphing come together: your numbers become the picture the team uses. Your supervisor makes decisions from the graph, so the graph is only as good as what you enter. Most agencies now use an app or software, but the rules are the same as on paper:
- Record during the session, or right when it ends. If you “think” a number was 4, it’s a guess.
- Enter data the same day, in the system your agency uses.
- If you didn’t collect data, say so. “Not collected” and “0” mean different things. Zero means you watched and the behavior did not happen.
- Check the new point against your data sheet before you save.
- If something on the graph looks wrong, tell your supervisor. Don’t change old data on your own.
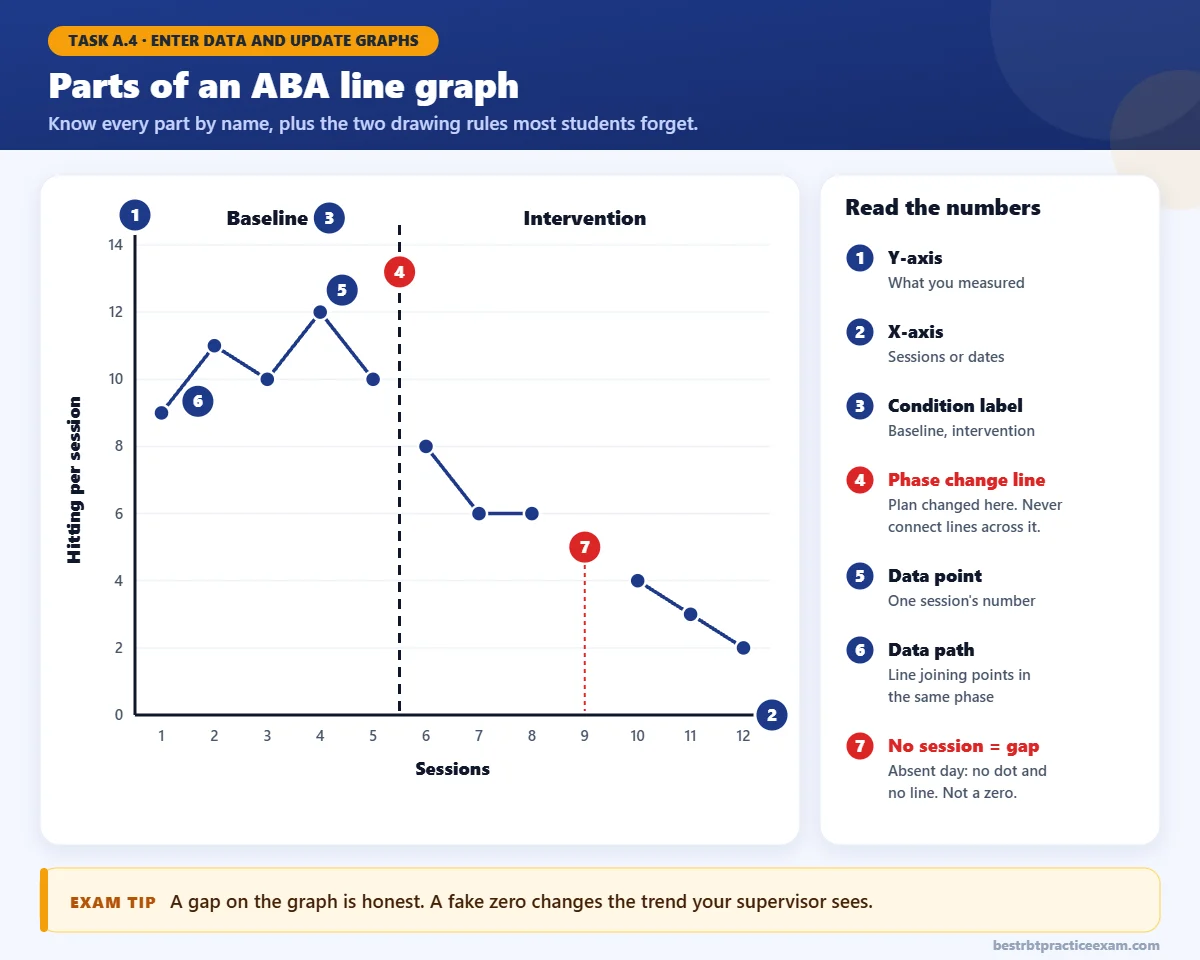
Two drawing rules come up often. Data paths do not cross a phase change line, and a missed session leaves a gap instead of a dot at zero. Both rules exist for the same reason: they keep the picture honest, so your supervisor sees what really changed.
Should all data be graphed?
For the targets in a treatment plan, yes. The graph shows change over time, and a stack of data sheets can’t show a trend at a glance. Your part is to collect the data accurately and enter it on time. Deciding what the graph means for the plan is your supervisor’s job.
A.5 Describe Behavior and Environment in Observable, Measurable Terms
Observable means you can see or hear it. Measurable means you can count it or time it. Here is a simple test: could a coworker read your note and record the same behavior tomorrow without asking you a single question? If not, the words are too vague.
Words like angry, lazy, bored, upset, or “had a meltdown” are guesses about feelings, or labels. Swap them for actions: what the learner did, how many times, and for how long.
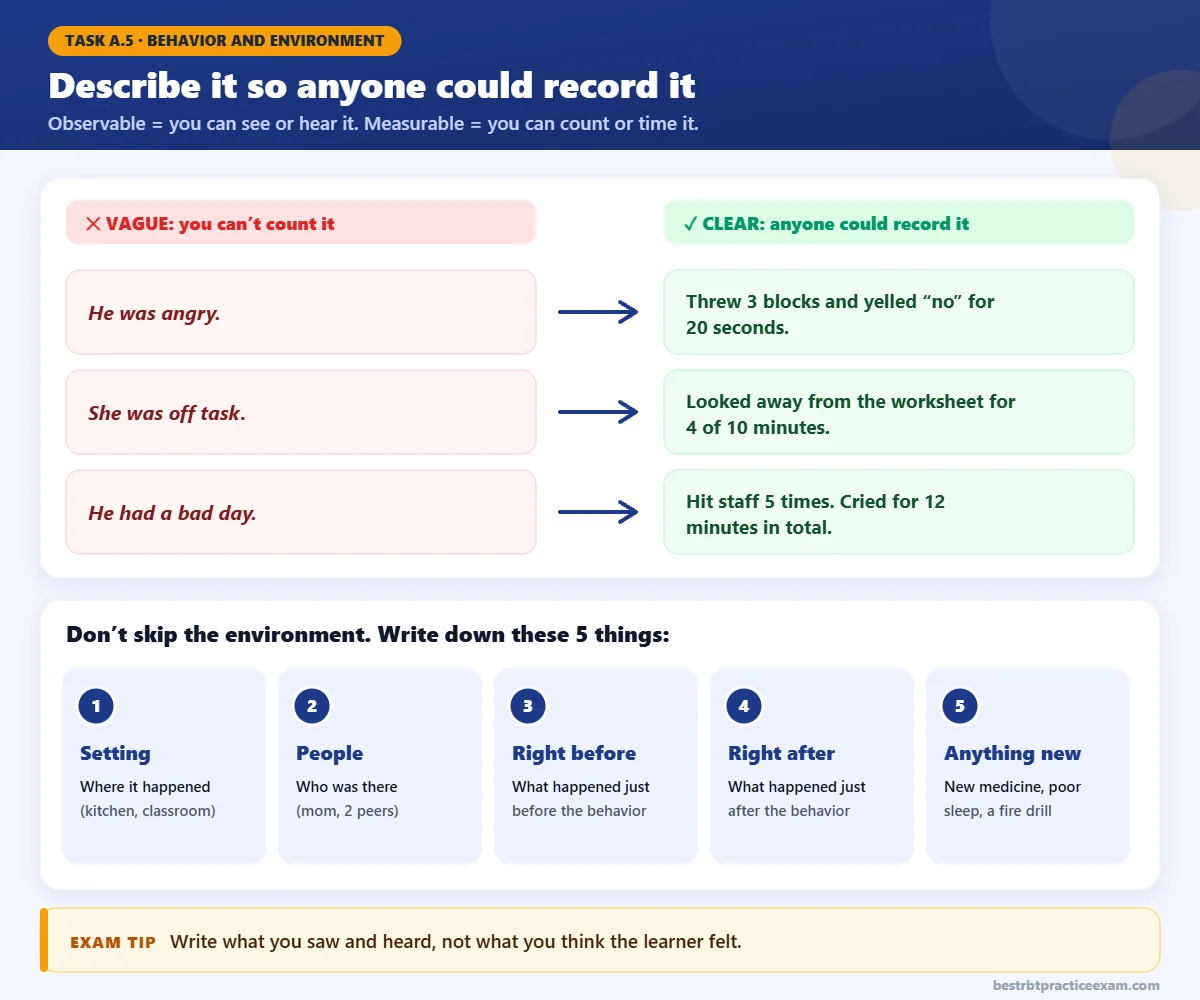
The part most guides skip: the environment
Task A.5 says behavior and environment. The environment is everything around the behavior that might affect it. Supervisors use it to spot patterns, like hitting that only happens during handwriting, or a rough morning after a late night. Write down:
- Setting: where it happened (kitchen, classroom, playground).
- People: who was there.
- Right before: what happened just before the behavior (the antecedent).
- Right after: what happened just after it (the consequence).
- Anything new or unusual: a new medication, poor sleep, a fire drill, a substitute teacher.
Weak: “Client was tired and grumpy. Bad session.” Clear: “Mom reported he went to bed after 11 pm. During handwriting he put his head on the table 4 times and pushed the worksheet off the table twice. No problem behavior during the tablet break.” The second note gives your supervisor something to work with.
What if a parent mentions a new medication? Write down exactly what you were told and what you saw, then let your supervisor know. Don’t guess how the medicine is affecting behavior. That call belongs to the supervisor and the family’s medical team. Our documentation and reporting guide covers session notes in more detail.
A.6 Calculate and Summarize Data
This is the newest piece of RBT data collection and graphing, added in the 3rd edition. The outline gives three examples: rate, mean duration, and percentage. All three are simple division. The exam hides the numbers inside a short session story, so read slowly and pull out only what you need.
Rate
12 hits in a 45-minute session. 45 minutes is 0.75 hours, so 12 ÷ 0.75 = 16 per hour.
Trap: change minutes into hours first when the question says “per hour.”
Mean duration
Three tantrums lasting 2, 5 and 8 minutes. 15 ÷ 3 = 5 minutes.
Trap: divide by the number of episodes, not the number of sessions.
Percentage
14 correct out of 20 trials. 14 ÷ 20 × 100 = 70%.
Trap: no total number of chances means no percentage.
Check your math
Type your own numbers. The steps show how the answer is built.
A.7 Identify Trends in Graphed Data
When you look at a graph, check three things in this order. Which way are the points heading? That is the trend. How high or low do they sit? That is the level. How much do they bounce from session to session? That is the variability.
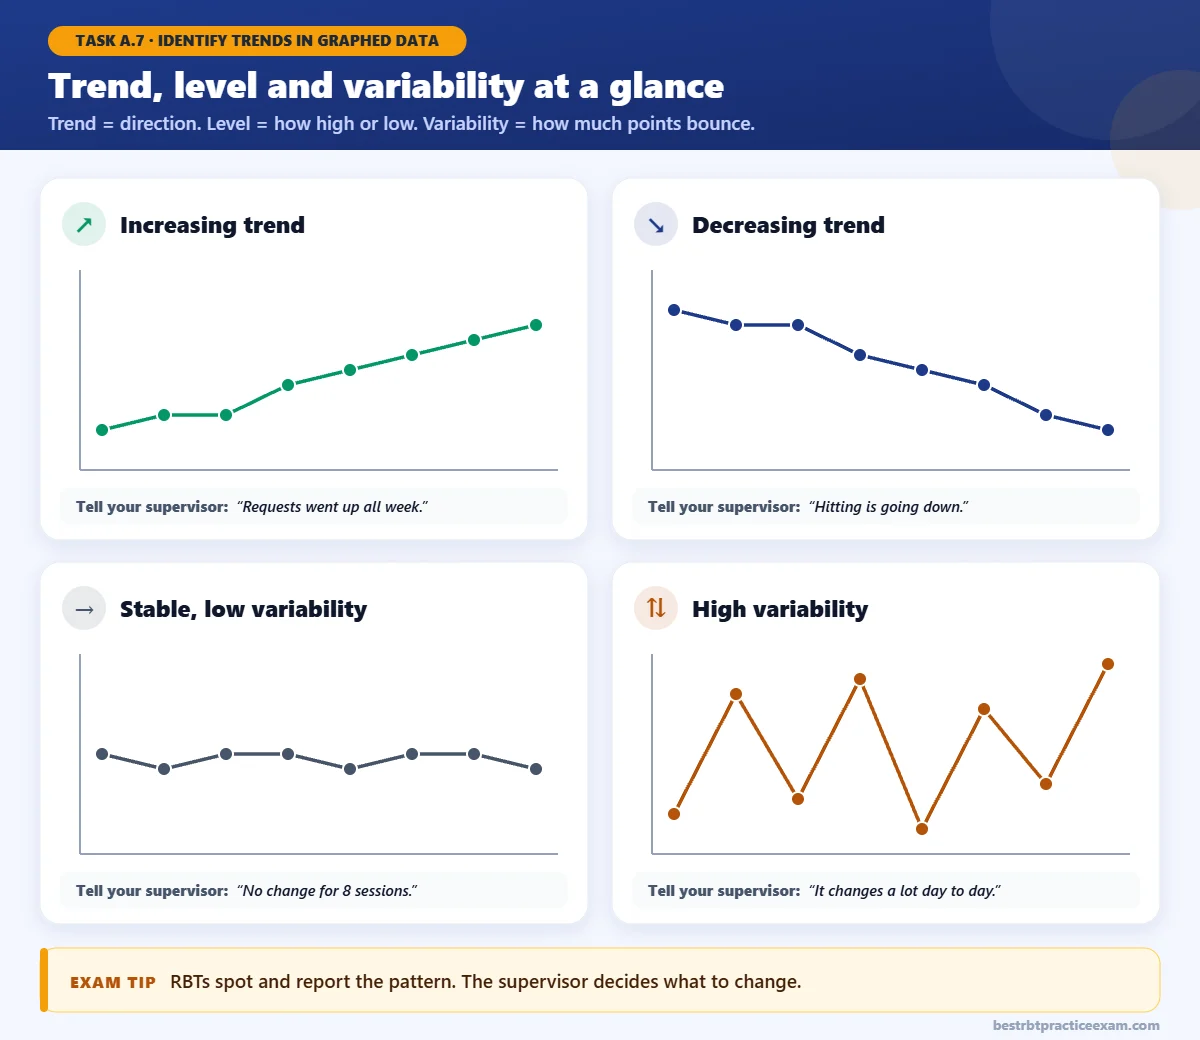
Next, look across the phase change line. Did the level drop soon after the intervention started? That is often the first sign a plan is helping. Your job is to notice the pattern and report it in plain words. Changing the plan is the supervisor’s decision.
What does baseline show?
Baseline is the data collected before a new intervention starts. It shows what the behavior looks like without the new plan, so the team has something to compare against. Without a steady baseline, nobody can say whether the plan made a difference.
An increasing trend is not always good news. More requests for help is great. More hitting is not. Always check which behavior the graph tracks before you call it progress.
A.8 Risks of Unreliable Data and Poor Procedural Fidelity
This new task is the “why” behind all of RBT data collection and graphing. It asks why sloppy data and sloppy procedures matter. The short answer is that the team makes real decisions about a real person from your numbers.
Data becomes unreliable when numbers are guessed, filled in from memory, recorded with a vague definition, or when two people score the same behavior in different ways. People can also slowly drift away from the original definition without noticing. This is called observer drift.
Procedural fidelity means running the plan exactly as it is written. If the plan says to wait 5 seconds before prompting and you prompt right away, the learner’s correct answers may look great. But they show your prompts, not the learner’s skill.
What can go wrong
- A goal gets marked as mastered too early, and the skill falls apart later.
- A plan that isn’t working stays in place for weeks.
- A plan that is working gets changed for no reason.
- A more restrictive procedure gets added because the numbers looked worse than they really were.
- Parents and funders receive progress reports that aren’t accurate.
Interobserver agreement (IOA) and when to recalibrate
To check whether data is reliable, a supervisor or a second person may record the same session and compare scores. This is interobserver agreement, or IOA. The simplest version divides the smaller count by the larger one. You count 16, your supervisor counts 20, so 16 ÷ 20 × 100 = 80%.
Low agreement isn’t about blame. It usually means the definition needs work or someone needs a quick refresher. That is the moment to recalibrate: review the definition together, score a few practice examples, and compare again. IOA math is not its own RBT task, but knowing why your supervisor checks it helps you answer A.8 questions.
A Real Session: RBT Data Collection and Graphing From Start to Finish
Here is how the tasks above fit together in one ordinary 2-hour session.
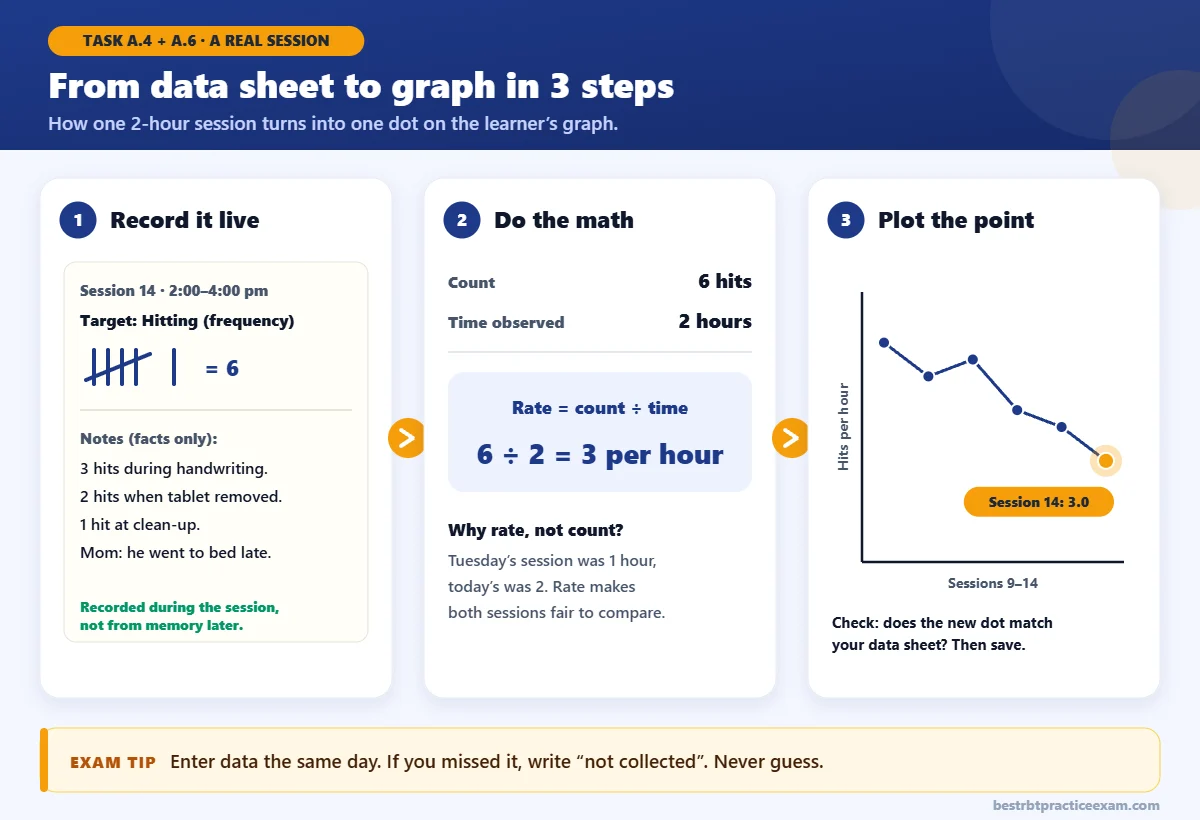
- Before the session: check each target, its definition, and how it is measured. Have your timer and data sheet or app ready.
- During the session: tally each hit as it happens and jot down facts: 3 during handwriting, 2 when the tablet was taken away, 1 at clean-up.
- At the end: 6 hits in 2 hours is 3 per hour. Use rate, because Tuesday’s session was only 1 hour long.
- Same day: enter the number and make sure the new dot matches your sheet.
- Report: if something stands out, like a pattern around the tablet, mention it to your supervisor.
That one afternoon touches A.1, A.4, A.5, and A.6. On the exam, questions often mix tasks the same way.
RBT Data Collection and Graphing Practice Questions
Try each one before you open the answer. These RBT data collection and graphing questions are written in the style of the real exam, not copied from any test bank.
Q1. A teacher wants a learner to raise their hand more often in class. Each raise is quick and easy to see. Which measure fits best?A) Duration B) Frequency C) Whole interval D) Latency
Q2. Every 2 minutes, when a timer beeps, the RBT looks up and records whether the learner is working at that moment. What method is this?A) Partial interval B) Whole interval C) Momentary time sampling D) Permanent product
Q3. The RBT marks an interval if the learner yells at any time during it. Compared with the real amount of yelling, this method will most likely:A) Overestimate B) Underestimate C) Be exact D) Miss all yelling
Q4. The goal is to increase how long a learner plays with a peer. Which interval method is the safer choice?A) Partial interval B) Whole interval C) Momentary time sampling D) Latency
Q5. After the session, the RBT grades a spelling test: 18 of 20 words are correct. What type of measurement is this, and what is the score?
Q6. A learner hits 12 times during a 45-minute session. What is the rate per hour?A) 12 B) 16 C) 27 D) 9
Q7. The learner was sick and Wednesday’s session was cancelled. How should Wednesday look on the graph?
Q8. Before the session, a parent says the learner started a new medication this morning. What should the RBT do?
RBT Data Collection and Graphing Cram Sheet
Read this the night before or right before you walk into the test center.
| Term | One-line rule |
|---|---|
| Frequency | Count every time it happens. |
| Rate | Count ÷ time. Use it when session lengths differ. |
| Duration | Start of the behavior → end of the behavior. |
| Latency | Instruction or cue → start of the response. |
| IRT | End of one response → start of the next. |
| Partial interval | Any time in the interval. Overestimates. Behaviors to decrease. |
| Whole interval | The entire interval. Underestimates. Behaviors to increase. |
| Momentary time sampling | Only at the end moment. Can miss either way. |
| Permanent product | Score the result after the behavior is over. |
| Mean duration | Total time ÷ number of episodes. |
| Percentage | Correct ÷ total chances × 100. |
| Phase change line | The plan changed here. Don’t connect data across it. |
| No data vs zero | Gap = not observed. 0 = observed, didn’t happen. |
| Procedural fidelity | Running the plan exactly as written. |
| IOA | Two observers compare scores to check if data is reliable. |
RBT Data Collection and Graphing FAQs
How many RBT data collection and graphing questions are on the exam?
13 of the 75 scored questions, which is 17% of your score. The exam also mixes in 10 unscored pilot questions, so you won’t know which ones count. Read more in our guide on how many questions are on the RBT exam.
Is RBT measurement the same as data collection and graphing?
Yes. “Measurement” was the name in the RBT Task List (2nd ed.). Starting in 2026, the 3rd edition calls it RBT data collection and graphing and adds three tasks: calculating and summarizing data, identifying trends, and the risks of unreliable data and poor procedural fidelity.
What is the difference between latency and IRT?
Latency starts when an instruction or cue is given and ends when the response begins. IRT starts when one response ends and stops when the next response begins. Ask what starts the clock: a cue means latency; a previous response means IRT.
Which interval method overestimates behavior?
Partial interval recording overestimates, because one brief instance marks the whole interval. Whole interval recording underestimates. Momentary time sampling can be off in either direction.
Do RBTs decide what to change when a graph shows a trend?
No. RBTs collect accurate data, enter it on time, notice patterns, and report them. Your supervisor, usually a BCBA or BCaBA, decides whether the plan should change.
You finished Domain A. Now make it stick.
Reading feels like learning, but answering questions shows you what you really know. Take the RBT data collection and graphing quiz while this is fresh, then move on to the next domain.
Ready for a full run? Try the 85-question practice exam